Why Hundreds of South Africans Have Signed The Wall
May 19, 2026
A factual progression
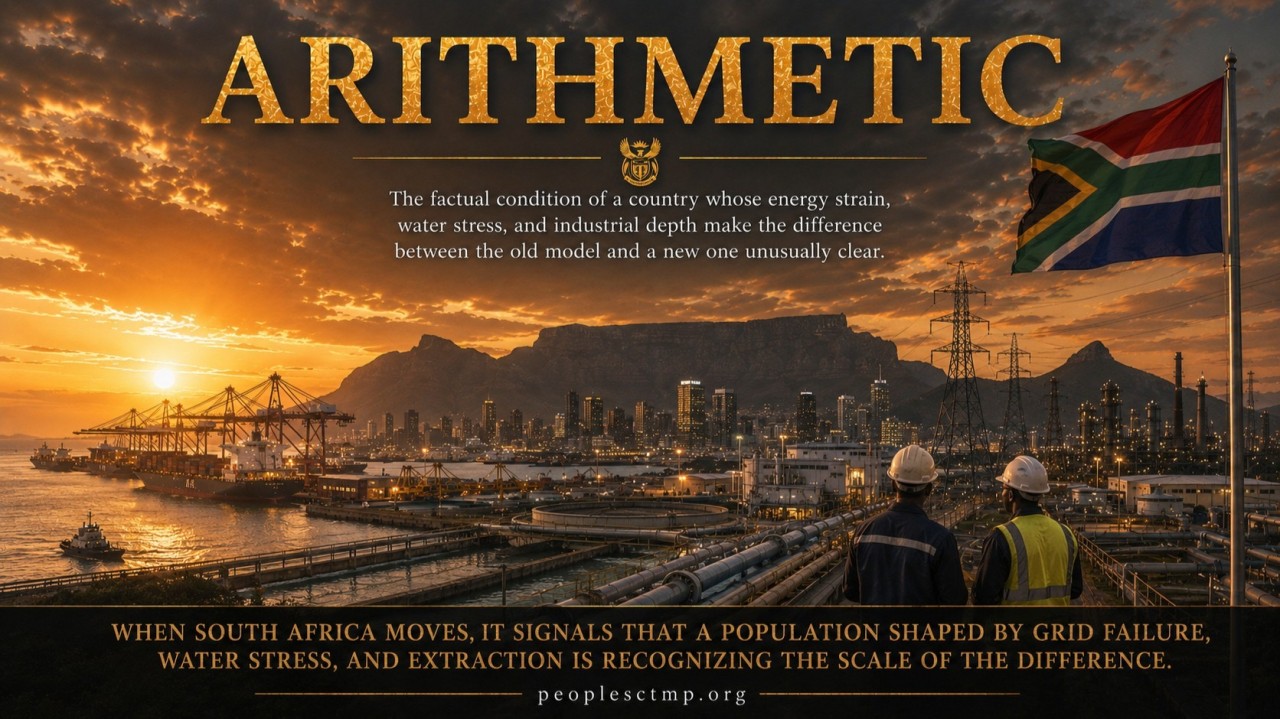
South Africa is leading The Wall by threshold progress.
Hundreds of South Africans have now signed.
I want to walk through the reasons in the order they actually matter, starting with the one that has shaped daily life more than almost anything else in the country over the last fifteen years: electricity.
This is not an emotional piece. I am going to lay out the facts in sequence and let the reader draw the conclusion. If the conclusion the reader draws is that South Africa has rational grounds to be at the top of the leaderboard, that is the conclusion the evidence supports. If someone wants to call it coincidence, they are free to do that too.
The facts are the facts either way.
The grid
South Africa’s electricity system has carried a structural wound for roughly fifteen years.
That is not a figure of speech. It is a description of an operating condition. The country’s primary generation base has long depended on a coal-fired fleet built in an earlier industrial era. Many of those stations are old, maintenance-heavy, and operating beyond the period in which a healthy national grid should be relying on them as the backbone of national supply.
Two newer stations, Medupi and Kusile, were intended to relieve that pressure. Construction began in the late 2000s. Both projects ran far behind schedule. Both became associated with major cost overruns. Both suffered repeated technical and operational problems. Both were supposed to help close the supply gap, but neither removed the underlying vulnerability in time. South African academic and public-sector records document serious cost and schedule overruns around these projects. [1]
The result was load-shedding: a controlled rolling blackout system designed to prevent total grid collapse by cutting demand when available supply could not meet national need.
That sentence sounds technical, but every South African knows what it means in real life.
It means businesses buying diesel because the grid cannot be trusted. It means traffic lights down. It means cold rooms failing. It means schoolwork interrupted. It means factories running below capacity. It means people planning their lives around an outage schedule. It means a modern economy being forced to operate like it is negotiating with its own nervous system.
The economic cost has been real. The South African Reserve Bank has linked load-shedding to a major drag on growth, with 2023 estimates commonly placing the impact around roughly two percentage points of growth in that year. Earlier official work also showed that concentrated load-shedding can produce severe GDP contraction under stress scenarios. [2]
The important correction is this: the situation has improved recently. Eskom reported its first full-year profit in eight years for the financial year ending March 2025, and Reuters reported that power cuts fell to 13 days that year from 329 days the year before. That improvement matters. It should be acknowledged honestly. [3]
But improvement does not erase the structural memory of the crisis.
A country does not live through years of load-shedding and forget what it learned. People learned that installed capacity on paper is not the same as reliable electricity in practice. They learned that a grid can be technically present and socially unreliable at the same time. They learned that electricity is not simply a utility bill. It is the floor under every business, every hospital, every school, every home, every mine, every data center, every cold chain, every farm, and every future plan.
That is the first reason South Africans are signing.
They know what energy failure feels like.
The utility
The electricity problem is not only technical. It is financial.
Eskom has carried historic debt at a scale that made the utility a sovereign problem, not just a utility problem. Public reporting and official statements have repeatedly placed Eskom debt in the hundreds of billions of rand, with debt relief and restructuring efforts aimed at reducing the burden while keeping the system operational. [3]
That matters because a power utility with a debt crisis cannot simply build its way out of trouble without someone paying. The payment usually arrives through tariffs, bailouts, borrowing, deferred maintenance, or some combination of all four.
South Africans have lived that too.
NERSA approved an 18.65 percent Eskom tariff increase for the 2023 financial year and 12.74 percent for the following year. Later decisions continued the pattern of above-inflation pressure, including a 12.7 percent increase for 2025/26, with additional increases approved for later years. [4]
That is the second fact pattern South Africans have lived inside: higher electricity prices layered on top of years of unreliable supply.
Even if the utility has recently improved operationally, the public memory remains. People paid more while getting less. They reorganized homes and businesses around a system that could not consistently deliver the thing modern life depends on most.
That is not abstract.
That is lived arithmetic.
What one CTMP module claims to produce
A People’s CTMP module is designed around 300 gigawatts of generation capacity. Under the current CTMP architecture, the annual net generation per module is approximately 2,500 terawatt-hours.
South Africa generated approximately 231,066 gigawatt-hours of electricity in 2025, or about 231 terawatt-hours, according to Statistics South Africa’s published electricity data. [5]
That means one CTMP module, if verified and built to specification, would produce more than ten times the annual electricity currently generated in South Africa.
That is the first arithmetic shock.
The second is price.
The CTMP Core has a posted external tariff of $0.025 per kilowatt-hour. The recommended end-user ceiling in a CTMP-verified jurisdiction is $0.05 per kilowatt-hour, exclusive of taxes and regulated delivery. That ceiling is not presented as a market target. It is a Charter-governed limit.
The claim is not that people should take this on faith. The claim is that the design, the Charter, and the pricing logic are published so they can be reviewed, challenged, tested, and verified.
That is why The Wall matters.
A South African reading those numbers is not being asked to respond to a slogan. They are looking at the difference between the energy system they have lived under and a proposed system whose entire public claim rests on verified abundance, governed pricing, and no private right to widen the spread.
That is not emotional persuasion.
That is arithmetic.
Why a South African would read those numbers and sign
A South African signing The Wall is not signing because they were moved by an inspirational paragraph.
They are signing because the comparison is obvious.
They know what electricity instability costs. They know what diesel backup costs. They know what tariff increases feel like. They know what it means when a business cannot run because the grid cannot be trusted. They know what it means when a family pays more for a service that has failed them repeatedly.
So when they see a platform claiming a governed electricity ceiling, a published Charter, a no-debt Core, no IPO, no private control lever, and module-scale output that exceeds national generation many times over, they do not need to be told why it matters.
They can do the math themselves.
That is the core of why South Africa is leading.
It is not flag-waving.
It is not sentiment.
It is substitution.
One set of numbers is being compared with another set of numbers.
The water
The same pattern applies to water.
South Africa is a water-stressed country. World Bank data places South Africa’s renewable internal freshwater resources per capita at a low level by global comparison, and international water datasets consistently identify the country as facing serious water-resource pressure. [6]
Cape Town’s 2018 Day Zero crisis gave the world one of the clearest modern examples of what municipal water insecurity can look like in a major city. The city came close enough to shutting off ordinary household water supply that residents were preparing for rationed collection points. [7]
Johannesburg has since shown a different version of the same vulnerability. AP reported in 2024 that taps had run dry across South Africa’s largest city in an unprecedented water crisis, with millions affected and water tankers becoming part of daily life in some areas. [8]
This matters because energy and water failure are not separate stories.
Pumps need power. Treatment systems need power. Distribution systems need maintenance. Municipal systems need revenue. A country with electricity fragility and water fragility is not facing two unrelated problems. It is facing a systems problem.
A CTMP module is designed to produce approximately two billion cubic meters per year of desalinated, mineral-balanced potable water for the host country under the Charter’s free allocation provision.
At 50 liters per person per day, two billion cubic meters per year is enough for approximately 109.6 million people. Even at the World Health Organization’s lower emergency reference of 20 liters per person per day, the coverage is larger. The WHO emergency guidance identifies 20 liters per person per day as a minimum quantity required for basic health and hygiene, while broader domestic-use planning often uses higher figures depending on context. [9]
South Africa’s mid-year population was estimated by Statistics South Africa at approximately 63.1 million in 2025. [10]
So the water arithmetic is direct.
The country has documented water stress.
The module claims a water output larger than the country’s basic-needs requirement.
The Charter says that water goes to the host country as a free allocation.
A South African signing The Wall is not signing a mood.
They are signing after seeing the gap.
The fiscal position
South Africa’s fiscal space is constrained.
The 2025 Budget projected national government debt stabilizing at approximately 77.4 percent of GDP in 2025/26. Debt-service costs remain a major pressure on public finances, reducing the room available for new public investment. [11]
That matters because major infrastructure normally arrives with a question attached.
Who borrows?
Under the standard model, the host country often carries the risk directly or indirectly. It may borrow. It may guarantee. It may sign long-term payment obligations. It may accept foreign ownership of operating assets. It may carry the political consequences if the project fails, costs more than expected, or locks the country into unfavorable terms.
CTMP is designed to avoid that structure.
A CTMP module deployed in a host country is financed through the platform’s own capital structure. It does not require the host country to borrow for the Core. It does not require sovereign guarantees over the Core. It does not put debt above the Core. It does not require the host country to mortgage future public budgets to receive the infrastructure.
That is materially different from the usual offer.
A South African signing The Wall is also performing a calculation about fiscal exposure.
Under the CTMP structure, the proposition is: no sovereign debt for the Core, no IPO, no private control lever, and no right to widen the spread.
That is why the structure matters as much as the engineering.
The mining and materials position
South Africa is not just an energy-consumer country. It is a deep industrial country with a mining and metallurgical history few countries can match.
The country has long experience in deep-shaft mining, ore processing, metallurgy, and heavy industrial operations. Its mineral endowment includes major platinum group metals, gold, chromium, manganese, vanadium, and other strategic minerals.
It also has a workforce and industrial knowledge base that has been under pressure for decades. Historical mining employment was far higher in the late twentieth century than it is today, and recent public reporting still places formal mining employment in the hundreds of thousands rather than at its historical peak. [12]
That matters because CTMP is not only a power plant.
It is a vertical platform.
The brine refinery vertical is designed to extract valuable materials from desalination concentrate. The green steel, green concrete, turbine, tunneling, materials, logistics, and industrial verticals all require people who understand industrial reality, not just software diagrams.
South Africa already has part of that human infrastructure.
That is why the country’s response makes sense.
A CTMP module does not ask South Africa to pretend it is something else. It asks South Africa to use what it already knows how to do, but under a different economic structure.
The old model extracts raw value and sends the upside elsewhere.
The CTMP model is designed to keep downstream value in the host country under the Charter.
That distinction matters in South Africa.
People there understand extraction in their bones.
What the Charter changes
The country has seen large external infrastructure promises before.
Some have proceeded. Some have not. The pattern is familiar: long-term liability, foreign ownership pressure, imported capital conditions, cost escalation, political exposure, and cash flows that do not remain where the public burden lands.
The CTMP Charter is designed to block those outcomes at the structural level.
External equity in any vertical is capped. Control cannot be bought past the ownership ceiling. End-user electricity pricing is bounded by the Charter. The Core carries no debt. The Core cannot be pledged. The platform cannot be taken public. The water allocation is a Charter obligation, not a commercial upsell. Wages are tied to a dignity floor rather than to the lowest level the market will tolerate. The Sovereign Logic Engine enforces the Charter mechanically.
These provisions should not be treated as vibes.
They are the architecture.
A South African signing The Wall has enough institutional memory to recognize why that difference matters.
The country has seen the standard offer.
This is not the standard offer.
The leaderboard mechanics
The Wall’s verification threshold is set at five percent of a country’s population, with a floor of 250,000 signatures. For South Africa, with a population of roughly 63.1 million, that creates a threshold of roughly 3.15 million signatures.
Hundreds of signatures are still a small fraction of that threshold.
That must be said clearly.
South Africa is leading the leaderboard by threshold progress among currently active countries. It is not yet close to verification.
But hundreds of signatures are still meaningful because they are different from a handful of signatures. A few dozen names can come from one person’s immediate network. A few hundred names usually means the link has begun moving beyond the original circle.
That is the signal.
Not completion.
Recognition.
South Africa has not reached the verification threshold.
But it has crossed into public recognition.
That matters.
What CTMP cannot do for South Africa
CTMP cannot resolve the political contests that shape South African governance. It cannot rewrite the post-apartheid settlement. It cannot reform political parties. It cannot fix policing. It cannot end gender-based violence. It cannot complete land restitution. It cannot rebuild the school system. It cannot guarantee equal outcomes between urban and rural areas.
Those are South African political tasks.
The platform has no jurisdiction over them.
CTMP also cannot make a host country wise. The free water allocation can be well managed or poorly managed. New energy can be used strategically or wasted politically. Industrial opportunity can be used to rebuild capacity or squandered through patronage.
The Charter sets the terms of delivery.
The country decides what it does with what it receives.
CTMP also cannot bypass the South African state. The Wall measures civic intent. It does not bind the government. A module can only be sited where the host government accepts the Charter terms and the required legal architecture.
Those limits are real.
They should be on the record.
But the arithmetic in the favorable direction is also real.
The two should be weighed together.
What the cards show
So here is where the cards lay.
South Africa has lived through a documented electricity crisis that damaged growth, business confidence, household life, and institutional trust. Even with recent operational improvement, the lesson of those years remains.
The country has a documented water infrastructure problem, including Cape Town’s Day Zero crisis and Johannesburg’s more recent water outages.
The country has documented fiscal constraints that limit its ability to solve these problems through traditional sovereign-financed infrastructure.
The country has a deep mining, metallurgical, and industrial skill base that has been underused and under pressure.
The CTMP module architecture claims an electricity output more than ten times South Africa’s current annual generation, a water output large enough to cover basic national needs, a materials platform that matches South Africa’s industrial strengths, and a financing structure that does not require sovereign debt over the Core.
The Charter prevents the standard extraction pattern by design.
Hundreds of South Africans have seen that arithmetic and added their names to the public ledger.
That is why South Africa is leading The Wall.
Not because of a campaign.
Not because of coincidence.
Because the numbers are unusually clear.
Other countries on the leaderboard, including Bulgaria, Ireland, the UAE, Peru, Singapore, Malaysia, and others, are running their own version of the same arithmetic in their own contexts. Each country’s arithmetic is different. South Africa’s arithmetic happens to be one of the clearest because the gap between current conditions and module-deployment conditions is so large.
That is the reason for the lead.
It is a population doing the math.
Closing
I have written this in a factual register because the situation does not require emotional reinforcement.
The numbers are sufficient.
The architecture is published at peoplesctmp.org. The Charter is available for review. The Wall is open. Verification is free, anonymous, and takes a few seconds.
If you are South African and you have not yet signed, the public ledger is open. Your country’s position on the leaderboard reflects the cumulative arithmetic of the people who have already signed. Your signature changes that arithmetic by one unit.
If you are not South African, the same applies to your country. Every country on Earth is eligible. The first to reach verification gets reviewed first. The Charter operates identically in every jurisdiction.
The facts are the facts.
The cards lay where they lay.
Christopher M. Coode Founder and CEO, Hutchison Lea ConneXions Inc. Architect and Steward, People’s CTMP peoplesctmp.org
Numbered References
[1] Medupi and Kusile cost and schedule overruns, with documented delivery problems in South African public-sector analysis.
[2] Load-shedding as a drag on South African growth and economic output, including estimates around the 2023 growth impact.
[3] Eskom’s FY2025 turnaround, first full-year profit in eight years, and reduction in power-cut days from 329 to 13.
[4] NERSA tariff approvals, including 18.65 percent for 2023/24, 12.74 percent for 2024/25, and 12.7 percent for 2025/26.
[5] Statistics South Africa electricity data showing 2025 generation of approximately 231,066 GWh.
[6] South Africa freshwater-resource pressure, via World Bank freshwater-resources-per-capita data.
[7] Cape Town’s Day Zero crisis and the reservoir/tap-shutoff threshold context.
[8] Johannesburg’s 2024 water crisis, including taps running dry and water tankers affecting millions.
[9] WHO emergency water guidance identifying 20 liters per person per day as a minimum safe-water quantity for basic health and hygiene.
[10] Statistics South Africa 2025 mid-year population estimate of approximately 63.1 million.
[11] South Africa 2025 Budget projection of debt stabilizing around 77.4 percent of GDP in 2025/26.
[12] South African mining employment and long-term sectoral pressure.